Tel:+86-575 -87957662
 Email:
 English
 中文简体
中文简体
Oil film pressure monitoring stands as one of the most reliable early warning systems for tilting pad bearings. When pressure readings deviate from expected values, it often signals the onset of wear, film instability, or load distribution problems—conditions that, if undetected, can escalate to catastrophic bearing failure within hours. This guide walks you through the practical mechanics of pressure monitoring, from measurement principles to actionable maintenance decisions, providing the technical foundation needed to protect your critical rotating equipment.
Why Oil Film Pressure Matters in Tilting Pad Bearings
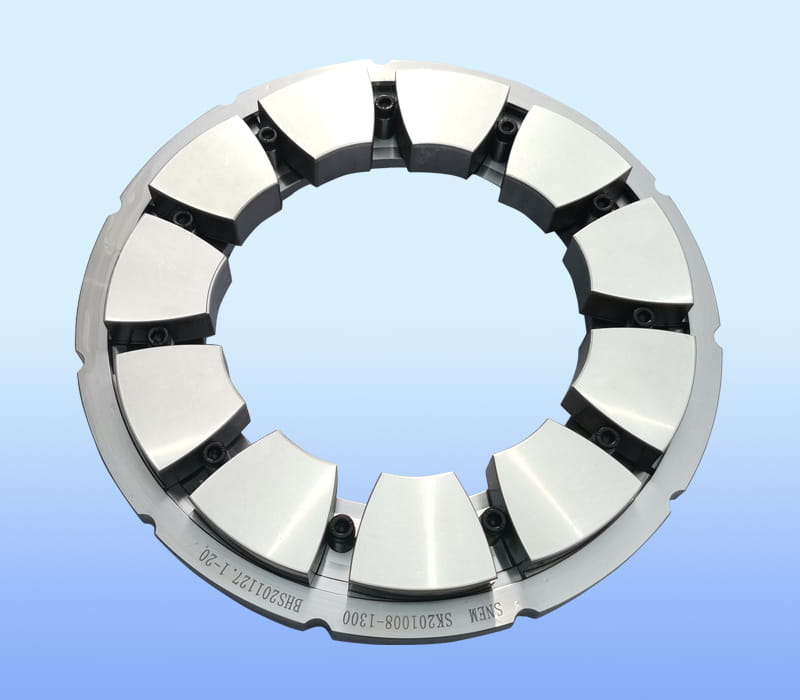
Tilting pad bearings operate on a principle fundamentally different from fixed-geometry designs. Each pad forms an independent converging oil wedge, allowing the bearing to generate pressure dynamically as the shaft rotates. This self-adjusting geometry delivers superior load capacity and thermal stability, but it also introduces complexity in monitoring—you cannot simply measure bearing temperature and declare the bearing healthy.
The Role of Hydrodynamic Pressure
Within a tilting pad bearing, oil film pressure performs three critical functions:
- Carries the applied load through the oil film, preventing metal-to-metal contact
- Maintains a minimum film thickness that preserves bearing longevity
- Suppresses oil film whirl—a self-excited oscillation that can lead to instability and catastrophic failure
Research into bearing pressure distributions has revealed a key phenomenon: the dynamic pressure field within the wedge exhibits a bimodal distribution pattern. The pressure peak occurs not at the film entrance but in the convergent region, with a secondary pressure plateau developing in certain pad configurations. Conversely, pressure in the hydrostatic (supply) chamber remains constant across the pad surface. Understanding this distinction is essential when selecting measurement locations and interpreting data.
Early Detection Through Pressure Anomalies
When oil film pressure deviates from the baseline established during normal operation, the root cause typically falls into one of these categories:
| Pressure Anomaly | Likely Root Cause | Consequence if Unaddressed |
|---|---|---|
| Sustained pressure drop below 40% of baseline | Supply oil starvation, filter blockage, or viscosity loss | Film breakdown, pad wear, metal contact |
| Cyclical pressure oscillations synchronized with shaft speed | Oil film whirl, load zone instability | Erratic bearing behavior, eventual failure |
| Skewed pressure distribution across pads (one pad pressure 15% above design range) | Uneven load distribution, pad tilt misalignment, or thermal growth | Accelerated wear on overloaded pad, potential pad separation |
| Pressure spikes during speed transients without subsequent stabilization | Bearing stiffness change, residual runout, or coupling misalignment | Bearing whip onset, catastrophic failure possible |
A critical insight often overlooked: shaft speed has a more pronounced effect on bearing load-carrying capacity than the magnitude of external load itself. This means that monitoring during speed ramps and transient conditions is just as important—if not more so—than steady-state monitoring. Pressure behavior at partial speed reveals pad engagement quality, alignment, and oil delivery adequacy before full-speed operation begins.
Measurement Methods and Sensor Selection
Strategic Pressure Tap Placement
The location of your pressure measurement points directly determines the signal quality and diagnostic value of your data. Placement strategy must account for pad geometry, bearing configuration (five-pad, six-pad, or tilting-pad with load-between-pads architecture), and the specific failure modes you wish to detect.
For a standard five-pad bearing, recommended measurement locations include:
- One tap in the convergent region of the load-carrying pad (typically 60-70% along the pad length from the leading edge)—captures peak dynamic pressure and pad engagement quality
- Secondary taps in the non-load pads to verify load distribution symmetry and detect unexpected pressure growth indicating misalignment
- One tap in the hydrostatic supply chamber (if applicable) to monitor feed pressure independently and confirm supply line integrity
A critical consideration often overlooked in bearing design: transient speed conditions matter more than static load for pad deflection and engagement. Measurement taps should be positioned to capture pressure behavior across the full operating speed range. Pressure readings taken only at rated speed may miss critical instability indicators that emerge during ramp-up or load step changes. At speeds below 50% of rated value, pad engagement may be incomplete, resulting in artificially low or erratic pressure readings. This is not a fault condition—it is a normal consequence of hydrodynamic film formation—but it must be recognized to avoid false alarms during machinery startup.
Pro Tip: During machinery commissioning, establish baseline pressure profiles at multiple speed setpoints (25%, 50%, 75%, 100% of rated speed). These profiles become your reference for detecting future degradation. A 10% deviation in pressure at 25% speed is far more significant than a 3% drift at full speed.
Sensor Types and Specifications
Two primary sensor technologies serve bearing pressure monitoring, each with distinct advantages and trade-offs:
Flush Diaphragm Pressure Transducers: These sensors feature a diaphragm that sits flush with the bearing surface or cavity, minimizing dead volume and improving frequency response. They excel at detecting high-frequency pressure oscillations indicative of oil film instability and whirl phenomena. However, they require direct access to the measurement point and demand careful installation to prevent blockage or contamination.
Embedded or Remote Pressure Sensors: Mounted away from the bearing cavity and connected via tubing, these sensors tolerate installation in confined spaces and permit easier replacement. The trade-off is reduced bandwidth—the tubing attenuates high-frequency signals—making them better suited for detecting low-frequency (shaft speed and below) anomalies rather than oil film whirl dynamics.
For most machinery, a hybrid approach proves effective: one flush sensor in the load-zone measurement point for film instability detection, and one remote sensor in the supply chamber for monitoring feed pressure stability.
Temperature Integration: Pairing pressure sensors with bearing metal temperature probes (RTD or thermocouple) dramatically improves diagnostic confidence. Pressure drop coupled with temperature rise signals film breakdown; pressure rise without temperature change suggests viscosity increase or thermal growth affecting pad geometry. In machinery where bearing metal temperature may exceed 107 degrees Celsius during extreme transients or emergency shutdown conditions, manual machine disconnect is often necessary to prevent white metal (babbitt) softening and seizure. Pressure monitoring alone cannot predict this event, but the combined pressure-temperature trend does.
High-Temperature Considerations: In applications where bearing environment temperatures routinely exceed 80 degrees Celsius, sensor cable insulation, connector materials, and amplifier electronics must be rated for sustained high-temperature exposure. Standard PVC cable breaks down rapidly above 80 degrees Celsius; specify silicone or PTFE-insulated cable instead. Similarly, sensor diaphragm material must resist stress relaxation at elevated temperature—AISI 316L stainless steel is preferred over carbon steel for long-term reliability.
Data Interpretation: From Raw Readings to Diagnostic Insights
Baseline Profiles in Healthy Bearings
Before you can detect abnormality, you must first establish what normal looks like. A healthy bearing exhibits these characteristics:
- Pressure in the load zone stabilizes within 3-5 minutes after start-up and shows minimal drift over hours of steady-state operation
- Pressure across all pads falls within the design envelope specified by the bearing manufacturer; typically, non-load pads carry 20-40% of the load-pad pressure
- Frequency spectra of pressure signals (if recorded with dynamic data acquisition) show energy concentrated at shaft speed and low harmonics; no broadband noise or random high-frequency content
- Pressure scales roughly with speed squared (due to hydrodynamic film development) during acceleration, and returns to expected values when speed stabilizes
Recognizing Warning Signs
Symptom: Skewed Pressure Distribution
One pad pressure reading consistently 15% or higher above design value while another pad remains unusually low signals load imbalance. Causes include thermal growth of the bearing housing (resulting in non-uniform pad clearance), rotor runout exciting certain pads preferentially, or coupling misalignment forcing load onto one side. Immediate action: record rotor vibration data and verify foundation temperature. If thermal growth is the culprit, allow cooldown; if alignment is poor, schedule re-coupling.
Symptom: Cyclic Pressure Oscillations
Pressure fluctuations that repeat at shaft speed or below—especially those that grow in amplitude over time—indicate oil film whirl or flutter. Unlike noise or vibration (which may be tolerable in some applications), film whirl carries inherent risk of bearing instability. Do not operate extended periods with suspected film whirl; the condition is often a precursor to bearing collapse. Low oil viscosity, excessive bearing clearance, or rotor instability are common root causes.
Symptom: Pressure Step Change at Operating Speed
If pressure suddenly drops 20-30% while speed and load remain constant, suspect supply line restriction (filter clogging, valve malfunction) or film breakdown if accompanied by temperature rise. Pressure rise without cause may indicate bearing pad liftoff or hydrostatic supply pressure malfunction. In either case, investigate immediately; such step changes rarely self-correct.
Transient Pressure Behavior During Speed Ramps
Machinery start-up and speed ramps contain a wealth of diagnostic information often overlooked by operators focused only on steady-state readings. During acceleration from 0 to 50% of rated speed, observe these benchmarks:
- Pressure should rise smoothly, roughly tracking speed-squared, with no abrupt jumps or oscillations
- All pads should show pressure growth; if one or more pads remain at near-zero pressure during early ramp, suspect inadequate bearing supply pressure or severe pad misalignment
- Pressure rise should be reproducible from start to start; significant variability indicates thermal drift or clearance inconsistency
Many bearing failures occur not at steady state but during transients when the machine cannot yet develop stable film. Operators who focus only on steady-state monitoring miss the critical window where intervention can prevent failure. Recommend recording pressure and temperature at a minimum of 30-second intervals during all start-ups and speed changes, increasing scan frequency to every 5 seconds in the 25-75% speed range where pad engagement is most sensitive.
From Monitoring Data to Maintenance Decisions
Decision Logic for Planned Shutdowns
Pressure data alone does not mandate bearing replacement; context and trends determine the appropriate action. Use this decision tree:
- Pressure within 5% of baseline + temperature stable: Continue operation; perform routine inspection at next scheduled maintenance window.
- Pressure declined 10-15% + temperature elevated 5-10 degrees Celsius: Schedule bearing inspection within 1-2 weeks; likely causes include film thickness degradation or incipient wear.
- Pressure declined more than 20% OR temperature risen more than 15 degrees Celsius + any skew in pad distribution: Plan bearing replacement within days; do not operate through multiple speed ramps or thermal cycles before inspection.
- Pressure oscillating with growing amplitude + bearing metal temperature exceeding 100 degrees Celsius: Stop machinery immediately and conduct bearing inspection; risk of oil film collapse is imminent.
Data Logging Best Practices
Many bearing failures are preceded by subtle pressure trends invisible in snapshots or operator log entries. Implement continuous or high-frequency data logging following these guidelines:
| Operating Condition | Recommended Scan Interval | Retention Period |
|---|---|---|
| Steady-state operation at rated speed and load | Every 60 seconds | 30 days minimum |
| Speed ramp or acceleration to operating speed | Every 5 seconds from 0-100% speed | Retain indefinitely for trend analysis |
| Load transients (pump stroke change, compressor unload, etc.) | Every 10 seconds for 5 minutes before and after event | Full operating record |
| Shutdown and cooldown | Every 30 seconds until temperature stable | 30 days minimum |
Continuous logging at these intervals is not excessive; modern data acquisition systems with cloud connectivity make historical trend analysis routine. The payoff is substantial: a single early detection of bearing degradation—preventing a catastrophic failure—justifies years of logging infrastructure costs.
Communicating with Bearing Manufacturers
When abnormal pressure readings emerge and you need expert guidance, prepare a complete data package for the bearing manufacturer or OEM. Include:
- Bearing design specifications (number of pads, pad angle, preload geometry, clearance values)
- Baseline pressure readings established during commissioning or known-good operation
- Current pressure readings at multiple load and speed points
- Temperature profile of bearing metal at the same measurement points
- Rotor vibration data if available, with emphasis on subsynchronous (oil whirl) frequencies
- Oil analysis results if recent, including viscosity, particle count, and any evidence of wear metals
This data package allows the manufacturer to model your bearing's pressure behavior and identify whether the anomaly indicates a design issue, manufacturing defect, or operating condition outside design envelope. Many apparent "bearing failures" are actually operator errors or system issues external to the bearing itself—clear data accelerates diagnosis.
Custom Monitoring Solutions for Critical Machinery
Different machinery types and applications impose distinct pressure monitoring requirements. A steam turbine bearing experiences steady, constant load; a reciprocating compressor bearing faces cyclic load reversals; a hydroelectric generator bearing contends with extreme load and thermal instability from water temperature swings. Each demands a tailored measurement strategy.
Turbomachinery (Turbines, Compressors, Blowers): These machines prioritize steady-state pressure stability and detection of oil film instability. Measurement taps should cluster in the load zone; detection bandwidth should extend to at least 2-3 times shaft speed to capture whirl frequencies. Supply pressure monitoring is secondary unless feed starvation is suspected.
Heavy Reciprocating Equipment (Compressors, Engines): Cyclic loading creates pressure pulses that can mask underlying trends. Consider low-pass filtering to detect mean pressure trends separately from transient spikes. Multiple pads must be monitored to capture load zone migration as the reciprocating load direction changes.
Hydroelectric and Marine Equipment: Thermal instability from varying water temperature demands integrated temperature monitoring alongside pressure. Pressure alone is insufficient; temperature trends and rate of change are equally diagnostic. Supply line pressure is critical because water ingress or cavitation can starve the bearing even when external pump pressure appears adequate.
Rather than applying a generic monitoring setup, collaborate with bearing specialists to design measurement configurations aligned with your machinery type, operating envelope, and failure consequence. The investment in a well-engineered monitoring plan—selecting optimal tap locations, appropriate sensor technology, and diagnostic algorithms—pays dividends through extended bearing life and reduced catastrophic failures.
Frequently Asked Questions
Q1: Can I use just temperature monitoring instead of pressure monitoring?
Temperature monitoring is valuable but insufficient alone. A bearing can show rising temperature only after significant wear has occurred; by that time, failure may be imminent. Pressure changes often precede temperature changes by days or weeks, providing advance warning. The two together are superior to either alone: pressure detects film instability early; temperature confirms the severity. If you must choose only one, pressure is the more diagnostic metric, but coupling both is best practice for critical equipment.
Q2: How often should pressure tap locations be checked for blockage or drift?
Visual inspection of tap fittings should occur during each machinery inspection interval—typically monthly for critical machines, quarterly for standard applications. If you observe unexpectedly low pressure readings or erratic data, first verify that the tap is not blocked with sludge or corrosion. A simple manual check with a pressure gauge connected to the tap line can distinguish true bearing pressure changes from instrumentation faults. If recurring blockage is an issue, consider flushing the tap line or relocating the measurement point slightly upstream in the flow path.
Q3: What is a reasonable cost for implementing pressure monitoring on an existing bearing?
Retrofit pressure monitoring to an installed bearing ranges from 800 to 3,500 USD depending on bearing size, accessibility of measurement locations, and data acquisition system complexity. A single pressure sensor and basic data logger can be installed for under 1,500 USD in most industrial applications. This cost is negligible compared to the risk exposure: a single bearing failure in critical machinery can result in 50,000 to 500,000 USD in lost production, equipment damage, and emergency repairs. Pressure monitoring is one of the most cost-effective predictive maintenance investments available.
Q4: Does oil viscosity change affect pressure readings, and how do I account for this?
Oil viscosity has a complex effect on bearing pressure. In the film formation zone, higher viscosity increases film thickness and pressure. However, higher viscosity also reduces oil flow, potentially starving the bearing if supply pressure is marginal. Temperature changes often correlate with viscosity drift—a bearing running 5 degrees Celsius hotter will see oil viscosity drop 5-10%, resulting in lower pressure. If you suspect viscosity changes, obtain an oil sample for viscosity measurement and re-baseline your pressure readings after oil change or major temperature shift. Pressure readings alone do not isolate the viscosity component, but coupling pressure and temperature data usually reveals the truth.
Q5: Can online pressure monitoring systems predict bearing failure with certainty?
No system predicts failure with perfect certainty because bearing failures have multiple causes and can escalate at varying rates. Pressure monitoring significantly improves your odds of early detection—typically 2-4 weeks before catastrophic failure. This advance notice is invaluable, permitting planned maintenance rather than emergency shutdowns. However, sudden external events (oil supply interruption, cooling water loss, unexpected load spike) can still cause rapid bearing collapse. Pressure monitoring is a critical layer of defense, but it does not replace robust design, proper installation, and vigilant operator response when alarms are triggered.
Q6: Are pressure readings different between loaded and unloaded pad positions in a five-pad bearing?
Yes, dramatically. The load-carrying pad typically shows 3 to 5 times higher pressure than non-load pads because only the load pad develops a significant pressure wedge. Non-load pads carry "parasitic" pressure from the hydrostatic supply and modest wedge action, often 20-40% of the load-pad value. If a non-load pad suddenly shows pressure elevation approaching the load-pad level, suspect load distribution imbalance or thermal distortion of the bearing shell. This is a red flag warranting bearing inspection within days.
Q7: How does bearing preload (if used) affect pressure readings?
Mechanical or hydrostatic preload on a tilting pad bearing alters the neutral plane and pad clearance, changing pressure magnitudes but not the diagnostic principle. A preloaded bearing will show higher baseline pressure than an unpreloaded bearing of the same size because the pads are closer to the shaft. Preload does not change the decision logic for detecting abnormality—deviations from the established baseline remain the diagnostic signal. When commissioning a preloaded bearing, ensure that baseline pressure is recorded under actual preload conditions so that future comparisons are valid.
Conclusion: Building a Sustainable Monitoring Practice
Monitoring oil film pressure in tilting pad bearings is not a one-time installation task but an ongoing commitment to data quality, trend analysis, and responsive maintenance decision-making. The technical knowledge required—understanding hydrodynamic film formation, recognizing pressure anomalies, interpreting transient behavior—is well within the reach of practicing engineers and technicians willing to invest time in learning.
The path from data collection to actionable insights follows these steps: establish robust baseline profiles at commissioning, maintain consistent measurement intervals during operation, recognize warning signs through comparative analysis, and escalate investigation when deviations exceed acceptable thresholds. This disciplined approach transforms pressure monitoring from a nuisance checkoff item into a powerful tool for extending bearing life and preventing costly failures.
If your organization operates critical machinery with tilting pad bearings, or if you are considering retrofitting pressure monitoring to existing equipment, professional consultation can accelerate design and ensure that your monitoring configuration addresses your specific operational challenges. Collaboration with bearing specialists and equipment manufacturers often reveals insights about your machinery that internal analysis alone might miss—pressure behavior anomalies that seem random often point to subtle design or installation issues that deserve expert attention.